Whether it’s tariffs, trade wars, or post-pandemic inflation caused by kink-ridden supply chains and what many experts believe to be excess money printing, inflation is an insidious drag on businesses’ operations. When it comes to energy’s contribution to inflation, the U.S. Energy Information Administration (EIA) reports that crude and natural gas prices in 2022 have increased on an annualized and weekly basis. Looking at the snapshot of 7/21/2022, WTI crude on the futures market was $96.35 a barrel. This was up more than $26 compared to 12 months ago, and $0.57 higher than a week earlier. For the same time frame, natural gas futures were $7.932/MMBtu, an increase of $3.973 from 12 months ago and an increase of $1.332 from a week earlier.
When it comes to businesses using any type of commodity, they’re faced with the question of how to raise retail prices when their prices increase. However, many business owners are hesitant to increase prices on their goods and services as they fear it will drive away customers. But in light of increasing input prices, not implementing price increases correctly will impact a business’s earnings and profitability.
As McKinsey & Company explains, there are many considerations why businesses have had trouble with mitigating costs in light of rising input costs. It’s important to monitor raw material costs with a fine-tooth comb. Businesses that bury costs of commodities, labor or tariffs under general accounting categories hide spikes in input costs due to factoring ancillary costs. If volatile input or uncontrollable factors, however, like tariffs can be monitored independently and in real time, businesses are more likely to be able to increase prices – and do so more gradually. With this in mind, McKinsey & Company highlighted four practices that businesses can implement to combat pressure from input costs and pushback from customers who question the reason for price increases.
1. Create a Database of Dynamic Costs
By looking at historical records going back as far as 36 months, businesses can determine trends and keep track of increases or decreases of input materials to share with the sales and customer service department, who can then communicate with customers. Along with looking at how contracts are written and if there are escalator clauses that permit conditions to adjust for increases in input materials, taking steps to accurately measure the impact of raw material costs can be helpful for price increase considerations.
It could look at costs by department. If a plating department at a manufacturing company plates 50,000 pieces of metal a month, incurs $200,000 of direct material costs and has $50,000 in labor and overhead costs, it can be broken down into a per unit cost of $4 for materials and $1 of labor and overhead costs. If the per unit cost of materials fluctuates, investigation can occur through the supply chain from the supplier to the price of futures contracts to see if prices can be negotiated or must be increased for customers.
2. Mind the Economy
Businesses are advised to keep an eye on current economic conditions. This is how companies can set a dynamic pricing strategy. Building on the first step, it’s advised to index prices to those of commodities to reduce the lag time between when companies experience changes in costs for their input materials and when retail prices actually reflect the true cost to the company. Be it fuel, wood, coffee or metals, understanding how the price of commodities fluctuates in real time is essential to determine when and how to adjust prices for retail customers. It also can help businesses determine how competitors are adjusting their pricing to customers, how far prices could increase, and how to augment delivery of goods or services to stay competitive and profitable.
In addition to escalation clauses, companies adapting to changing input material prices could, for example, introduce shorter-term contracts, look for more competitive suppliers, or substitute different but equal quality/performance materials.
3. Coaching Staff to Educate and Explain Price Fluctuations
Continual evaluations for sales teams are imperative. Supervisors must see what accounts have (and have not) been informed of price increases. They should focus on what accounts have accepted price increases (and what level of price increases have been accepted). They also should look at what accounts are likely to accept price increases and what accounts are not likely to accept price increases. Businesses also must factor in the business cycle for the sales process and how each account is performing relative to its price increase targets due to cyclical increases in input commodity prices and interest rates for financing availability. Ongoing coaching should be implemented to identify major issues and ways to resolve them. Anticipating and preparing sales representatives for customer questions through role playing can help better prepare employees to explain why price increases are a part of doing business.
4. Managing Performance
Businesses must play the long game after products or services have been priced accordingly to commodity and input prices. Since inflation follows the economic cycle, upside and downside pricing dynamics can catch companies off guard. Consistently updated product or service pricing systems and prepared sales teams can lead to more profitable margins and hopefully the ability to weather volatile and long-term price spikes.
Much like the price of commodities and labor fluctuate based on dynamic market conditions, finding ways to adapt one’s business practices can increase chances of surviving and thriving in a challenging economy.
How Businesses Can Mitigate Inflation & Maintain Pricing Power
August 1, 2022 · Blog, General Business News
⏱ 5 min read
Whether it’s tariffs, trade wars, or post-pandemic inflation caused by kink-ridden supply chains and what many experts believe to be excess money printing, inflation is an insidious drag on businesses’ operations. When it comes to energy’s contribution to inflation, the U.S. Energy Information Administration (EIA) reports that crude and natural gas prices in 2022 have increased on an annualized and weekly basis. Looking at the snapshot of 7/21/2022, WTI crude on the futures market was $96.35 a barrel. This was up more than $26 compared to 12 months ago, and $0.57 higher than a week earlier. For the same time frame, natural gas futures were $7.932/MMBtu, an increase of $3.973 from 12 months ago and an increase of $1.332 from a week earlier.
When it comes to businesses using any type of commodity, they’re faced with the question of how to raise retail prices when their prices increase. However, many business owners are hesitant to increase prices on their goods and services as they fear it will drive away customers. But in light of increasing input prices, not implementing price increases correctly will impact a business’s earnings and profitability.
As McKinsey & Company explains, there are many considerations why businesses have had trouble with mitigating costs in light of rising input costs. It’s important to monitor raw material costs with a fine-tooth comb. Businesses that bury costs of commodities, labor or tariffs under general accounting categories hide spikes in input costs due to factoring ancillary costs. If volatile input or uncontrollable factors, however, like tariffs can be monitored independently and in real time, businesses are more likely to be able to increase prices – and do so more gradually. With this in mind, McKinsey & Company highlighted four practices that businesses can implement to combat pressure from input costs and pushback from customers who question the reason for price increases.
1. Create a Database of Dynamic Costs
By looking at historical records going back as far as 36 months, businesses can determine trends and keep track of increases or decreases of input materials to share with the sales and customer service department, who can then communicate with customers. Along with looking at how contracts are written and if there are escalator clauses that permit conditions to adjust for increases in input materials, taking steps to accurately measure the impact of raw material costs can be helpful for price increase considerations.
It could look at costs by department. If a plating department at a manufacturing company plates 50,000 pieces of metal a month, incurs $200,000 of direct material costs and has $50,000 in labor and overhead costs, it can be broken down into a per unit cost of $4 for materials and $1 of labor and overhead costs. If the per unit cost of materials fluctuates, investigation can occur through the supply chain from the supplier to the price of futures contracts to see if prices can be negotiated or must be increased for customers.
2. Mind the Economy
Businesses are advised to keep an eye on current economic conditions. This is how companies can set a dynamic pricing strategy. Building on the first step, it’s advised to index prices to those of commodities to reduce the lag time between when companies experience changes in costs for their input materials and when retail prices actually reflect the true cost to the company. Be it fuel, wood, coffee or metals, understanding how the price of commodities fluctuates in real time is essential to determine when and how to adjust prices for retail customers. It also can help businesses determine how competitors are adjusting their pricing to customers, how far prices could increase, and how to augment delivery of goods or services to stay competitive and profitable.
In addition to escalation clauses, companies adapting to changing input material prices could, for example, introduce shorter-term contracts, look for more competitive suppliers, or substitute different but equal quality/performance materials.
3. Coaching Staff to Educate and Explain Price Fluctuations
Continual evaluations for sales teams are imperative. Supervisors must see what accounts have (and have not) been informed of price increases. They should focus on what accounts have accepted price increases (and what level of price increases have been accepted). They also should look at what accounts are likely to accept price increases and what accounts are not likely to accept price increases. Businesses also must factor in the business cycle for the sales process and how each account is performing relative to its price increase targets due to cyclical increases in input commodity prices and interest rates for financing availability. Ongoing coaching should be implemented to identify major issues and ways to resolve them. Anticipating and preparing sales representatives for customer questions through role playing can help better prepare employees to explain why price increases are a part of doing business.
4. Managing Performance
Businesses must play the long game after products or services have been priced accordingly to commodity and input prices. Since inflation follows the economic cycle, upside and downside pricing dynamics can catch companies off guard. Consistently updated product or service pricing systems and prepared sales teams can lead to more profitable margins and hopefully the ability to weather volatile and long-term price spikes.
Much like the price of commodities and labor fluctuate based on dynamic market conditions, finding ways to adapt one’s business practices can increase chances of surviving and thriving in a challenging economy.
These articles provide general information on tax, accounting, and financial topics for small businesses and individuals. They are educational in nature and are not specific legal, accounting, financial, tax, or other professional advice, and should not be relied upon as such. This content was prepared by Service2Client and may have been reviewed or edited by the website owner for accuracy and compliance. Look for a trust mark below for verification details. No representation is made that any approach described will achieve a particular result, and no regulatory or professional body has reviewed or endorsed this content. Because each situation is different, readers should consult a qualified professional about their specific circumstances before acting. Images accompanying these articles are protected by copyright and may not be copied or reused.
Starting June 1, the Fed began reducing its balance sheet holdings of U.S. Treasuries by $30 billion a month for three months. Thereafter, it will double its reduction of U.S. Treasuries by $60 billion per month beginning in the fourth month. For its mortgage-backed securities, the first three months will see $17.5 billion roll off its balance sheet. Starting in the fourth month of the program, this cap will increase to $35 billion per month. As its dual mandate is to both maintain employment and a stable rate of inflation, this is another way the Fed is implementing its monetary policy to put the brakes on inflation and reign in out-of-control demand with limited supply. How will the Fed’s unwinding of its balance sheet impact markets for the rest of 2022?
Instead of quantitative easing (QE), where the Fed bought U.S. Treasuries and mortgage-backed securities to foster more demand for U.S. Treasuries and lower bond yields, QT is the opposite. According to the Federal Reserve Bank of St. Louis, quantitative tightening (QT) is the reverse type of policy that aims to unwind holdings on the Fed’s balance sheet. To tame inflation, QT removes liquidity from economic institutions and raises rates for long-dated assets.
In response to the COVID-19 pandemic, the Fed bought U.S. Treasury securities and agency mortgage-back securities (MBS) again in March 2020 to provide stability by maintaining a source of easily accessible credit for consumers and business owners. The Fed bought $80 billion of Treasury securities and $40 billion of MBS per month. The Fed’s balance sheet grew from $3.9 trillion (March 2020) to $8.5 trillion (May 2022). Looking at it from a percentage of GDP, it increased from 18 percent to 35 percent. When QT is in full force, it is expected to lower the Fed’s balance sheet by at least $1.1 trillion annualized. Over a three-year timeframe, it is expected to remove about $3 trillion over 36 months.
When it comes to the process of QT, it is important to understand how it works and impacts the overall market dynamics. When U.S. Treasuries and mortgage-backed securities mature, the respective issuing agency pays them off and the Fed receives payment. Unlike QE where the proceeds were reinvested, the proceeds will not be reinvested during QT and the Fed’s balance sheet will fall in size.
When it comes to global central banks implementing their own versions of QT, it is estimated that as much as $2 trillion will be removed from markets over the next 12 months. Looking at the Fed alone, it is aiming to reduce $1 trillion or 11 percent of its holdings from the balance sheet over the next year. If QT continues through 2024, its holdings will drop from 37 percent of GDP to 20 percent. With the Fed’s balance sheet containing almost $9 trillion and inflation being 8.5 percent of the current CPI reading, this pace is higher because the last time it conducted QT, the Fed’s balance sheet held $4.5 trillion in assets with a CPI of 2.75 percent.
Looking at potential scenarios of QT outcomes, the Fed has published three respective impacts on the Fed’s policy rate. The Baseline scenario, or following what began on June 1, would lead to what’s effectively a policy rate increase of 56 basis points. This is compared to a “no-runoff scenario,” leaving the Fed’s balance sheet with another $2.1 trillion in Q3 of 2024, whereby there is no QT in place. Looking at the full-runoff scenario, it would let $0.8 trillion roll off the Fed’s balance sheet by Q3 of 2024, necessitating a nine-basis point drop in the policy rate to offset the balance sheet’s negative impact on the macroeconomy.
When the pandemic struck in March 2020, the Fed Funds rate was cut to between 0 percent and 0.25 percent. On Jan 26, 2022, the FOMC maintained its target range for the federal funds rate at 0 percent to 0.25 percent. Fast forward to June 15, 2022: The FOMC raised its target range for the federal funds rate to between 1.5 percent and 1.75 percent. Depending on the evolving economic data surrounding inflation, the Fed appears willing to further adjust its target range. It is important to explore how the federal funds rate has led the market to interpret asset purchasing or unwinding actions by the Fed.
During 2017 and 2018, the FOMC increased the federal funds rate by 175 basis points, bringing it to approximately 2.25 percent. St. Louis Fed President Jim Bullard argued that once the federal funds rate is north of zero, be it QE or QT, how the balance sheet grows or shrinks has little say on how the Fed will steer its monetary policy.
While the economy is in uncharted territory due to its emergence from the COVID-19 pandemic and evolving monetary policy, only time will tell how much of an effect QT will have on the U.S. and global markets.
How Will the Federal Reserve’s Quantitative Tightening Impact Markets?
July 1, 2022 · Blog, Stock Market News
⏱ 4 min read
Starting June 1, the Fed began reducing its balance sheet holdings of U.S. Treasuries by $30 billion a month for three months. Thereafter, it will double its reduction of U.S. Treasuries by $60 billion per month beginning in the fourth month. For its mortgage-backed securities, the first three months will see $17.5 billion roll off its balance sheet. Starting in the fourth month of the program, this cap will increase to $35 billion per month. As its dual mandate is to both maintain employment and a stable rate of inflation, this is another way the Fed is implementing its monetary policy to put the brakes on inflation and reign in out-of-control demand with limited supply. How will the Fed’s unwinding of its balance sheet impact markets for the rest of 2022?
Instead of quantitative easing (QE), where the Fed bought U.S. Treasuries and mortgage-backed securities to foster more demand for U.S. Treasuries and lower bond yields, QT is the opposite. According to the Federal Reserve Bank of St. Louis, quantitative tightening (QT) is the reverse type of policy that aims to unwind holdings on the Fed’s balance sheet. To tame inflation, QT removes liquidity from economic institutions and raises rates for long-dated assets.
In response to the COVID-19 pandemic, the Fed bought U.S. Treasury securities and agency mortgage-back securities (MBS) again in March 2020 to provide stability by maintaining a source of easily accessible credit for consumers and business owners. The Fed bought $80 billion of Treasury securities and $40 billion of MBS per month. The Fed’s balance sheet grew from $3.9 trillion (March 2020) to $8.5 trillion (May 2022). Looking at it from a percentage of GDP, it increased from 18 percent to 35 percent. When QT is in full force, it is expected to lower the Fed’s balance sheet by at least $1.1 trillion annualized. Over a three-year timeframe, it is expected to remove about $3 trillion over 36 months.
When it comes to the process of QT, it is important to understand how it works and impacts the overall market dynamics. When U.S. Treasuries and mortgage-backed securities mature, the respective issuing agency pays them off and the Fed receives payment. Unlike QE where the proceeds were reinvested, the proceeds will not be reinvested during QT and the Fed’s balance sheet will fall in size.
When it comes to global central banks implementing their own versions of QT, it is estimated that as much as $2 trillion will be removed from markets over the next 12 months. Looking at the Fed alone, it is aiming to reduce $1 trillion or 11 percent of its holdings from the balance sheet over the next year. If QT continues through 2024, its holdings will drop from 37 percent of GDP to 20 percent. With the Fed’s balance sheet containing almost $9 trillion and inflation being 8.5 percent of the current CPI reading, this pace is higher because the last time it conducted QT, the Fed’s balance sheet held $4.5 trillion in assets with a CPI of 2.75 percent.
Looking at potential scenarios of QT outcomes, the Fed has published three respective impacts on the Fed’s policy rate. The Baseline scenario, or following what began on June 1, would lead to what’s effectively a policy rate increase of 56 basis points. This is compared to a “no-runoff scenario,” leaving the Fed’s balance sheet with another $2.1 trillion in Q3 of 2024, whereby there is no QT in place. Looking at the full-runoff scenario, it would let $0.8 trillion roll off the Fed’s balance sheet by Q3 of 2024, necessitating a nine-basis point drop in the policy rate to offset the balance sheet’s negative impact on the macroeconomy.
When the pandemic struck in March 2020, the Fed Funds rate was cut to between 0 percent and 0.25 percent. On Jan 26, 2022, the FOMC maintained its target range for the federal funds rate at 0 percent to 0.25 percent. Fast forward to June 15, 2022: The FOMC raised its target range for the federal funds rate to between 1.5 percent and 1.75 percent. Depending on the evolving economic data surrounding inflation, the Fed appears willing to further adjust its target range. It is important to explore how the federal funds rate has led the market to interpret asset purchasing or unwinding actions by the Fed.
During 2017 and 2018, the FOMC increased the federal funds rate by 175 basis points, bringing it to approximately 2.25 percent. St. Louis Fed President Jim Bullard argued that once the federal funds rate is north of zero, be it QE or QT, how the balance sheet grows or shrinks has little say on how the Fed will steer its monetary policy.
While the economy is in uncharted territory due to its emergence from the COVID-19 pandemic and evolving monetary policy, only time will tell how much of an effect QT will have on the U.S. and global markets.
Disclaimer
These articles provide general information on tax, accounting, and financial topics for small businesses and individuals. They are educational in nature and are not specific legal, accounting, financial, tax, or other professional advice, and should not be relied upon as such. This content was prepared by Service2Client and may have been reviewed or edited by the website owner for accuracy and compliance. Look for a trust mark below for verification details. No representation is made that any approach described will achieve a particular result, and no regulatory or professional body has reviewed or endorsed this content. Because each situation is different, readers should consult a qualified professional about their specific circumstances before acting. Images accompanying these articles are protected by copyright and may not be copied or reused.
One of the perennial fears of taxpayers is getting audited by the IRS. Financially, few scenarios strike such fear into the heart of taxpayers. However, taxpayers can probably breathe a sigh of relief – at least for now. This is because the rate at which the IRS is initiating audits of individual taxpayers is dropping like a stone.
Decline in Audit Rates
The rate at which the IRS is auditing individual taxpayers has declined overall between the years of 2010 and 2019 (2020 data is too new and 2021 returns are still being filed through the extension period). According to the Government Accountability Office (GAO), nearly 1 percent of all taxpayers were audited in 2010 compared to only 0.25 percent for the tax year 2019. The GAO chart below shows the ski slope-like drop in individual tax audit rates over the period.
While the IRS continues to audit higher earning taxpayers more often overall, during the 10-year period audit rates consistently declined for all levels of taxpayers, except those with the highest incomes. The audit rate for taxpayers with income between $200k and $500k experienced the largest drop, with the audit rate declining from 2.3 percent down to 0.2 percent; a 92 percent reduction in audits. Taxpayers with the highest incomes, defined as $10 million or more, saw a resurgence in audit rates from 2017-2018; however, even they experienced an overall decline, dropping from 21.2 percent in 2019 to only 3.9 percent in 2019 – equating to an 81 percent decline.
Impact on the Treasury
There is the theory that the prospect of a tax audit leads to greater voluntary compliance. In other words, if people think they won’t get audited, then they are more likely to cheat on their taxes.
Non-compliance with tax laws and regulations have a material impact on the Treasury. According to the IRS, it is estimated that on average, individual taxpayers under-reported nearly $250 billion a year for the period 2011-2013. This obviously leads to the non-collection of taxes that are otherwise owed the government and raises issues of fairness for taxpayers who are playing by the rules.
Why the Decline in Audit Rates?
One of the main drivers is a lack of resources at the IRS, a combination of both reduced funding and less auditors on staff. The number of agents working for the IRS has declined across the board since 2011. Tax examiners, the type who handle basic audits by mail, have dropped by 18 percent. Meanwhile, revenue agents, who handle the more complex cases in the field, declined by more than 40 percent over the same period.
Demographics point to an increase in these trends as there are a wave of coming retirements in the IRS. Over the next three years, nearly 14 percent of current tax examiners and 16 percent of revenue agents are expected to retire. Stack on top of this the fact that the inexperience of newer agents and the time to complete audits is also taking longer.
Conclusion
The IRS claims it is missing out on millions in legally due tax revenues due to the inability to maintain enforcement. They say they need more funding to hire more agents to perform more audits, which not only find fraud in the audits themselves but also increase overall compliance due to the pressure this creates.
Currently, there is no political focus on bringing major new resources to the IRS, so it’s not likely to see an uptick in individual tax audit rates anytime soon. The trend of focusing on the highest earners, however, will likely continue as this is where the IRS can find the most bang for its buck.
The IRS is Auditing Fewer Returns than Ever
July 1, 2022 · Blog, Tax and Financial News
⏱ 3 min read
One of the perennial fears of taxpayers is getting audited by the IRS. Financially, few scenarios strike such fear into the heart of taxpayers. However, taxpayers can probably breathe a sigh of relief – at least for now. This is because the rate at which the IRS is initiating audits of individual taxpayers is dropping like a stone.
Decline in Audit Rates
The rate at which the IRS is auditing individual taxpayers has declined overall between the years of 2010 and 2019 (2020 data is too new and 2021 returns are still being filed through the extension period). According to the Government Accountability Office (GAO), nearly 1 percent of all taxpayers were audited in 2010 compared to only 0.25 percent for the tax year 2019. The GAO chart below shows the ski slope-like drop in individual tax audit rates over the period.
While the IRS continues to audit higher earning taxpayers more often overall, during the 10-year period audit rates consistently declined for all levels of taxpayers, except those with the highest incomes. The audit rate for taxpayers with income between $200k and $500k experienced the largest drop, with the audit rate declining from 2.3 percent down to 0.2 percent; a 92 percent reduction in audits. Taxpayers with the highest incomes, defined as $10 million or more, saw a resurgence in audit rates from 2017-2018; however, even they experienced an overall decline, dropping from 21.2 percent in 2019 to only 3.9 percent in 2019 – equating to an 81 percent decline.
Impact on the Treasury
There is the theory that the prospect of a tax audit leads to greater voluntary compliance. In other words, if people think they won’t get audited, then they are more likely to cheat on their taxes.
Non-compliance with tax laws and regulations have a material impact on the Treasury. According to the IRS, it is estimated that on average, individual taxpayers under-reported nearly $250 billion a year for the period 2011-2013. This obviously leads to the non-collection of taxes that are otherwise owed the government and raises issues of fairness for taxpayers who are playing by the rules.
Why the Decline in Audit Rates?
One of the main drivers is a lack of resources at the IRS, a combination of both reduced funding and less auditors on staff. The number of agents working for the IRS has declined across the board since 2011. Tax examiners, the type who handle basic audits by mail, have dropped by 18 percent. Meanwhile, revenue agents, who handle the more complex cases in the field, declined by more than 40 percent over the same period.
Demographics point to an increase in these trends as there are a wave of coming retirements in the IRS. Over the next three years, nearly 14 percent of current tax examiners and 16 percent of revenue agents are expected to retire. Stack on top of this the fact that the inexperience of newer agents and the time to complete audits is also taking longer.
Conclusion
The IRS claims it is missing out on millions in legally due tax revenues due to the inability to maintain enforcement. They say they need more funding to hire more agents to perform more audits, which not only find fraud in the audits themselves but also increase overall compliance due to the pressure this creates.
Currently, there is no political focus on bringing major new resources to the IRS, so it’s not likely to see an uptick in individual tax audit rates anytime soon. The trend of focusing on the highest earners, however, will likely continue as this is where the IRS can find the most bang for its buck.
Disclaimer
These articles provide general information on tax, accounting, and financial topics for small businesses and individuals. They are educational in nature and are not specific legal, accounting, financial, tax, or other professional advice, and should not be relied upon as such. This content was prepared by Service2Client and may have been reviewed or edited by the website owner for accuracy and compliance. Look for a trust mark below for verification details. No representation is made that any approach described will achieve a particular result, and no regulatory or professional body has reviewed or endorsed this content. Because each situation is different, readers should consult a qualified professional about their specific circumstances before acting. Images accompanying these articles are protected by copyright and may not be copied or reused.
Corporate profits, according to the Bureau of Economic Analysis, grew by $20.4 billion in the final quarter of 2021, a 0.7 percent increase. For the first quarter of 2022, corporate profits fell by 2.3 percent or $66.4 billion. On an annualized basis, corporate profits fell 5.2 percent in 2022, but grew 25 percent in 2021. With the economy facing inflation, the uncertainty of the Russia/Ukraine conflict, and the world working its way out of the COVID-19 pandemic, economic uncertainty abounds. For companies, measuring margins is one way to evaluate performance and strategize ways to survive and thrive in a dynamic economy. Here are a few common margins that businesses can determine to measure their financial performance.
Operating Margin Defined
Also referred to as return on sales, this measures the profit a business makes on a percentage basis, per dollar, from its core operations. It accounts for manufacturing costs that fluctuate, such as paying employees and input stock. The operating margin is determined by obtaining the business’ earnings before interest and taxes (EBIT) and dividing it by its net sales or sales revenue.
Operating Earnings = Revenue – (cost of goods sold (COGS) + overhead expenses, except tax and loan servicing costs)
Assuming a business had $10 million in revenue, $1.5 million of COGS and $750,000 in related overhead expenses, it would be as follows:
Operating Earnings = $10 million – ($1.5 million + $750,000) / $10 million
Operating Earnings = $10 million – ($2.25 million) / $10 million
Operating Earnings = $7.75 million / $10 million = 0.775 or 77.5%
Understanding the Operating Margin
This doesn’t factor in things such as taxes, interest on loans or other non-core business expenses. However, it gives a picture of what’s remaining for its non-core operating expenses, such as servicing outstanding loans. By looking at a company’s past operating margins, the trends can determine a company’s performance. Ways to improve the margin include reducing staff redundancy, negotiating better deals on raw materials or reaching more receptive customers.
Marginal Revenue Product (MRP)
If a piece of equipment or employee can create an output of X (the marginal physical product or MPP) and each additional unit of production sells at Z price (marginal revenue or MR), the MRP of the piece of the new investment is MPP x MR. Accepting that all other costs remain constant, if the business owner pays less than or equal to the MRP, it may be profitable. Otherwise, it’s not a good decision.
Using the example of a furniture manufacturer looking to respond to increased demand, this illustrates how it can guide business decisions. If a new employee can produce 100 tables every week that will retail for $100 per table, this is the MPP. Based on the calculation, the MPP of 100 multiplied by the marginal revenue (MR) of $100 = $10,000. If the business can hire and retain a new employee for less than $10,000 per week to increase their production by 100 tables per week, it can signal a positive investment.
Marginal Cost of Production
This metric is a way for businesses to determine efficient manufacturing costs. Looking at production volume, this calculation can determine if adding an additional unit to production would add profitability by examining fixed and variable costs. Fixed costs don’t change with modifications in production levels.
A static or fixed cost can be spread out over more units of increased production. However, if expanding production capacity requires additional fixed costs, it can add to the marginal cost of production, which will be explained shortly. When it comes to variable costs, as the name implies, as more production occurs, the costs similarly vary.
Assume company A makes widgets with $1 in variable costs and fixed costs of $10,000 per month, producing 5,000 widgets monthly. This would lead to $2 in fixed costs ($10,000 in fixed costs/5,000 widgets).
This final cost per widget comes to $3 ($2 fixed + $1 variable cost).
If company A chose to produce 10,000 widgets a month and they could use existing machinery, employees, etc., their fixed costs would drop to $1 ($10,000 in fixed costs/10,000 widgets).
Assuming the same variable cost of $1 per widget, plus the $1 in fixed costs, it would cost $2 per widget if the 10,000 widgets were produced. However, if additional investments (equipment, etc.) were needed to produce widget 5,001 to 10,000, this consideration would need to be factored in the marginal cost of production. If additional equipment costs $1,000 to increase production, the business would need to factor this in to see if it’s still profitable.
Essentially, if this additional production cost is less than the price of an additional individual unit, there’s the potential for a profit for the business.
Contribution Margin After Marketing (CMAM)
This measures how much cash is earned from a single unit sold after accounting for promotional and variable expenses. Example expenses include input stock, freight, inventory, etc. It’s important to distinguish between pre-planned marketing expenses over a set period of time (per month, quarter, etc.), and variable sales commissions that can fluctuate. CMAM is calculated as follows:
Looking at how much each unit can add to a business’ profitability:
CMAM for every Unit = Sales Revenue for every Unit – Variable Expenses for every Unit – Marketing Expense for every Unit
From there, a business’ net profit or loss can be found using this ratio:
Net Operating Profit = CMAM – Fixed Costs
Considerations
A smaller or negative CMAM is indicative of a product that’s likely uncompetitive. Conversely, a high CMAM, especially over a long time, can indicate the product is well regarded. It can help businesses to determine their most profitable products and/or what products to discontinue, etc.
With economic uncertainty expected to continue, keeping an eye on past, present and future margins is a key way to maintain a business’ chance of thriving in 2022 and beyond.
Corporate profits, according to the Bureau of Economic Analysis, grew by $20.4 billion in the final quarter of 2021, a 0.7 percent increase. For the first quarter of 2022, corporate profits fell by 2.3 percent or $66.4 billion. On an annualized basis, corporate profits fell 5.2 percent in 2022, but grew 25 percent in 2021. With the economy facing inflation, the uncertainty of the Russia/Ukraine conflict, and the world working its way out of the COVID-19 pandemic, economic uncertainty abounds. For companies, measuring margins is one way to evaluate performance and strategize ways to survive and thrive in a dynamic economy. Here are a few common margins that businesses can determine to measure their financial performance.
Operating Margin Defined
Also referred to as return on sales, this measures the profit a business makes on a percentage basis, per dollar, from its core operations. It accounts for manufacturing costs that fluctuate, such as paying employees and input stock. The operating margin is determined by obtaining the business’ earnings before interest and taxes (EBIT) and dividing it by its net sales or sales revenue.
Operating Earnings = Revenue – (cost of goods sold (COGS) + overhead expenses, except tax and loan servicing costs)
Assuming a business had $10 million in revenue, $1.5 million of COGS and $750,000 in related overhead expenses, it would be as follows:
Operating Earnings = $10 million – ($1.5 million + $750,000) / $10 million
Operating Earnings = $10 million – ($2.25 million) / $10 million
Operating Earnings = $7.75 million / $10 million = 0.775 or 77.5%
Understanding the Operating Margin
This doesn’t factor in things such as taxes, interest on loans or other non-core business expenses. However, it gives a picture of what’s remaining for its non-core operating expenses, such as servicing outstanding loans. By looking at a company’s past operating margins, the trends can determine a company’s performance. Ways to improve the margin include reducing staff redundancy, negotiating better deals on raw materials or reaching more receptive customers.
Marginal Revenue Product (MRP)
If a piece of equipment or employee can create an output of X (the marginal physical product or MPP) and each additional unit of production sells at Z price (marginal revenue or MR), the MRP of the piece of the new investment is MPP x MR. Accepting that all other costs remain constant, if the business owner pays less than or equal to the MRP, it may be profitable. Otherwise, it’s not a good decision.
Using the example of a furniture manufacturer looking to respond to increased demand, this illustrates how it can guide business decisions. If a new employee can produce 100 tables every week that will retail for $100 per table, this is the MPP. Based on the calculation, the MPP of 100 multiplied by the marginal revenue (MR) of $100 = $10,000. If the business can hire and retain a new employee for less than $10,000 per week to increase their production by 100 tables per week, it can signal a positive investment.
Marginal Cost of Production
This metric is a way for businesses to determine efficient manufacturing costs. Looking at production volume, this calculation can determine if adding an additional unit to production would add profitability by examining fixed and variable costs. Fixed costs don’t change with modifications in production levels.
A static or fixed cost can be spread out over more units of increased production. However, if expanding production capacity requires additional fixed costs, it can add to the marginal cost of production, which will be explained shortly. When it comes to variable costs, as the name implies, as more production occurs, the costs similarly vary.
Assume company A makes widgets with $1 in variable costs and fixed costs of $10,000 per month, producing 5,000 widgets monthly. This would lead to $2 in fixed costs ($10,000 in fixed costs/5,000 widgets).
This final cost per widget comes to $3 ($2 fixed + $1 variable cost).
If company A chose to produce 10,000 widgets a month and they could use existing machinery, employees, etc., their fixed costs would drop to $1 ($10,000 in fixed costs/10,000 widgets).
Assuming the same variable cost of $1 per widget, plus the $1 in fixed costs, it would cost $2 per widget if the 10,000 widgets were produced. However, if additional investments (equipment, etc.) were needed to produce widget 5,001 to 10,000, this consideration would need to be factored in the marginal cost of production. If additional equipment costs $1,000 to increase production, the business would need to factor this in to see if it’s still profitable.
Essentially, if this additional production cost is less than the price of an additional individual unit, there’s the potential for a profit for the business.
Contribution Margin After Marketing (CMAM)
This measures how much cash is earned from a single unit sold after accounting for promotional and variable expenses. Example expenses include input stock, freight, inventory, etc. It’s important to distinguish between pre-planned marketing expenses over a set period of time (per month, quarter, etc.), and variable sales commissions that can fluctuate. CMAM is calculated as follows:
Looking at how much each unit can add to a business’ profitability:
CMAM for every Unit = Sales Revenue for every Unit – Variable Expenses for every Unit – Marketing Expense for every Unit
From there, a business’ net profit or loss can be found using this ratio:
Net Operating Profit = CMAM – Fixed Costs
Considerations
A smaller or negative CMAM is indicative of a product that’s likely uncompetitive. Conversely, a high CMAM, especially over a long time, can indicate the product is well regarded. It can help businesses to determine their most profitable products and/or what products to discontinue, etc.
With economic uncertainty expected to continue, keeping an eye on past, present and future margins is a key way to maintain a business’ chance of thriving in 2022 and beyond.
These articles provide general information on tax, accounting, and financial topics for small businesses and individuals. They are educational in nature and are not specific legal, accounting, financial, tax, or other professional advice, and should not be relied upon as such. This content was prepared by Service2Client and may have been reviewed or edited by the website owner for accuracy and compliance. Look for a trust mark below for verification details. No representation is made that any approach described will achieve a particular result, and no regulatory or professional body has reviewed or endorsed this content. Because each situation is different, readers should consult a qualified professional about their specific circumstances before acting. Images accompanying these articles are protected by copyright and may not be copied or reused.
Often the first house a person buys is an affordable condominium, townhouse or older single-family dwelling, also referred to as a “starter home.” It might be small and lack features they dream about, from new appliances in the kitchen, to dual sinks in the bath, to a large yard or a garage.
However, the key to a starter home is not to acquire your dream house, it is to build equity that you can eventually deploy to buy your dream home. It’s important not to wait until you have enough money for the ideal property. Start as early as you can and buy something affordable to get your foot in the door of homeownership.
Interest Rates and Maintenance Expenses
Buying a home when mortgage interest rates are low offers a key advantage for building wealth because it reduces your loan payment, thereby freeing up more discretionary income to put toward other investments, home upgrades or pay down the mortgage balance.
When deciding your price range for purchasing a home, it’s also important to budget common maintenance costs, such as utilities, repairs and upgrades, as well as homeowner’s insurance and property taxes. These costs can be substantial, yet many new homebuyers do not account for them in their budget. They only take into consideration whether or not they can afford the monthly mortgage. It is always a good idea to have a lower payment that you can well afford in order to avoid relying on savings or credit to pay for maintenance expenses as they arise. And remember, maintenance of your property is critical because it can help improve your sale price when you move, which is key to building wealth.
Building Home Equity
The next step to building wealth through homeownership is to sell for a substantial profit. Home equity, which is the market price for which you can sell the home minus your remaining mortgage balance, is achieved in two ways. One way to build equity relies on the real estate market. Over time, houses generally increase in price, so most people are able to sell their home for more than they paid for it. How quickly home prices rise will depend on the overall economy and your home’s particular appeal. That’s why it’s important to make an attractive location one of your top requirements. For example, even if you don’t have children or want children, buying a home in a sought-after school district will likely increase the value of your home faster. Other location features include easy access to shopping districts, major highways and even an airport.
The second way to build equity is through the monthly payments you make on the mortgage, which reduce the balance owed. If you can afford it, adding more to your monthly payment and directing the excess toward your principal balance helps build home equity faster. Another payment option that can help build equity faster is to apply for a shorter-term loan than the standard 30-year mortgage. For example, a 15-year term mortgage features a lower interest rate and the borrower pays off the loan in half the time. Note that monthly payments will be higher, but a homeowner can save thousands of dollars in interest with a shorter-term loan.
Transaction Costs
The garden variety advice is to remain in your home for at least five years. That’s because selling your home and buying a new one involves substantial transaction expenses, from closing costs to initiating a new loan, as well as paying commission fees to both the seller’s and buyer’s real estate agents (usually 3 percent each). Therefore, you need to have lived in the property long enough to build equity through payments and market appreciation to offset these expenses and still make a profit.
Sales Tax
Be aware that it is advantageous to live in your primary residence for at least two years before you sell. Otherwise, your sales profit could be subject to capital gains taxes on the first $250,000 for single tax filers, and as much as $500,000 for married filing jointly. The tax rate is the same as your ordinary income tax rate if you owned property for less than one year; after that, the capital gains rate is based on your tax bracket (15 percent or 20 percent).
Trade Up, Then Down
Over many decades, you can build wealth by buying a home and then periodically “trading up” once you attain substantial equity. The tactic of trading up means you invest your profits in a more expensive home and then begin building equity again. One way to save for retirement is to keep trading up until you retire, then downsize to a less expensive home with lower maintenance expenses. At that point, you can redeploy the profit derived from the home equity you have accumulated into a stream of retirement income.
Today’s Market
In recent years, high prices and low inventory in the residential real estate market have made it harder for young adults to buy a starter home. For those currently shut out, keep saving until the market stabilizes, because the higher your down payment, the lower your monthly payments will be – and the more equity you’ll have in your home. You can still build wealth through homeownership, even if you start late.
Building Wealth Through Home Equity
July 1, 2022 · Blog, Financial Planning
⏱ 5 min read
Often the first house a person buys is an affordable condominium, townhouse or older single-family dwelling, also referred to as a “starter home.” It might be small and lack features they dream about, from new appliances in the kitchen, to dual sinks in the bath, to a large yard or a garage.
However, the key to a starter home is not to acquire your dream house, it is to build equity that you can eventually deploy to buy your dream home. It’s important not to wait until you have enough money for the ideal property. Start as early as you can and buy something affordable to get your foot in the door of homeownership.
Interest Rates and Maintenance Expenses
Buying a home when mortgage interest rates are low offers a key advantage for building wealth because it reduces your loan payment, thereby freeing up more discretionary income to put toward other investments, home upgrades or pay down the mortgage balance.
When deciding your price range for purchasing a home, it’s also important to budget common maintenance costs, such as utilities, repairs and upgrades, as well as homeowner’s insurance and property taxes. These costs can be substantial, yet many new homebuyers do not account for them in their budget. They only take into consideration whether or not they can afford the monthly mortgage. It is always a good idea to have a lower payment that you can well afford in order to avoid relying on savings or credit to pay for maintenance expenses as they arise. And remember, maintenance of your property is critical because it can help improve your sale price when you move, which is key to building wealth.
Building Home Equity
The next step to building wealth through homeownership is to sell for a substantial profit. Home equity, which is the market price for which you can sell the home minus your remaining mortgage balance, is achieved in two ways. One way to build equity relies on the real estate market. Over time, houses generally increase in price, so most people are able to sell their home for more than they paid for it. How quickly home prices rise will depend on the overall economy and your home’s particular appeal. That’s why it’s important to make an attractive location one of your top requirements. For example, even if you don’t have children or want children, buying a home in a sought-after school district will likely increase the value of your home faster. Other location features include easy access to shopping districts, major highways and even an airport.
The second way to build equity is through the monthly payments you make on the mortgage, which reduce the balance owed. If you can afford it, adding more to your monthly payment and directing the excess toward your principal balance helps build home equity faster. Another payment option that can help build equity faster is to apply for a shorter-term loan than the standard 30-year mortgage. For example, a 15-year term mortgage features a lower interest rate and the borrower pays off the loan in half the time. Note that monthly payments will be higher, but a homeowner can save thousands of dollars in interest with a shorter-term loan.
Transaction Costs
The garden variety advice is to remain in your home for at least five years. That’s because selling your home and buying a new one involves substantial transaction expenses, from closing costs to initiating a new loan, as well as paying commission fees to both the seller’s and buyer’s real estate agents (usually 3 percent each). Therefore, you need to have lived in the property long enough to build equity through payments and market appreciation to offset these expenses and still make a profit.
Sales Tax
Be aware that it is advantageous to live in your primary residence for at least two years before you sell. Otherwise, your sales profit could be subject to capital gains taxes on the first $250,000 for single tax filers, and as much as $500,000 for married filing jointly. The tax rate is the same as your ordinary income tax rate if you owned property for less than one year; after that, the capital gains rate is based on your tax bracket (15 percent or 20 percent).
Trade Up, Then Down
Over many decades, you can build wealth by buying a home and then periodically “trading up” once you attain substantial equity. The tactic of trading up means you invest your profits in a more expensive home and then begin building equity again. One way to save for retirement is to keep trading up until you retire, then downsize to a less expensive home with lower maintenance expenses. At that point, you can redeploy the profit derived from the home equity you have accumulated into a stream of retirement income.
Today’s Market
In recent years, high prices and low inventory in the residential real estate market have made it harder for young adults to buy a starter home. For those currently shut out, keep saving until the market stabilizes, because the higher your down payment, the lower your monthly payments will be – and the more equity you’ll have in your home. You can still build wealth through homeownership, even if you start late.
Disclaimer
These articles provide general information on tax, accounting, and financial topics for small businesses and individuals. They are educational in nature and are not specific legal, accounting, financial, tax, or other professional advice, and should not be relied upon as such. This content was prepared by Service2Client and may have been reviewed or edited by the website owner for accuracy and compliance. Look for a trust mark below for verification details. No representation is made that any approach described will achieve a particular result, and no regulatory or professional body has reviewed or endorsed this content. Because each situation is different, readers should consult a qualified professional about their specific circumstances before acting. Images accompanying these articles are protected by copyright and may not be copied or reused.
We’re all feeling the pain at the pump. Unless you decide to walk, bike or take public transportation, you might feel stuck. But all is not lost. Here are some fuel-efficient driving techniques that can help you save hundreds of dollars in fuel each year.
Don’t Drive Too Fast
Of course, when you’re on the highway, you must maintain a certain speed. However, cars, vans and pickups are typically the most fuel-efficient when driving between 50 and 80 mph. If you go any faster, you’ll use more gas. Consider this: When you’re driving roughly 75 miles per hour, you use 20 percent more fuel than you would if you were going around 60 mph. On a 15-mile trip, if you’re driving faster, you’ll only save two minutes. Only you know if shaving two minutes and gulping extra gas from your tank is worth it.
Maintain a Steady Speed
When you drive in bursts, slowing down and then accelerating, your fuel consumption increases. Specifically, tests have shown that varying your speed up and down between 75 and 85 mph every 18 seconds can bump up fuel usage by 20 percent. If your car has cruise control, use that. Word from the wise: Slow and steady wins the race.
Accelerate Gently
The heavier your foot is when putting the pedal to the metal, the more gas you use. Here’s how to accelerate and save gas: From a stop, take five seconds to get to 12 mph. You’ll speed on up after that, but the point is to pay attention to when you’re just starting and ease into your journey.
Coast to Decelerate
If you tend to have a heavy brake foot, you’re thwarting your forward momentum. Granted, you want to control your car if you’re in rain or snow. But here’s the trick: Look ahead to see what traffic is like and, if you have some room when you’re headed down that hill, take your foot off the gas and the brake, and enjoy the ride – you’ll conserve fuel and save money.
Try Not to Idle
Except when you’re in traffic, if you’re stopped longer than a minute, turn off your engine. The average vehicle with a three-liter engine drinks in over a cup of fuel for every 10 minutes it idles. Ouch!
Measure Tire Pressure
Do this every month. If your tires are under-inflated by 56 kilopascals (aka 8 pounds per square inch), fuel consumption rises by up to 4 percent. If you don’t know the right tire pressure for your car, look on the edge of the driver’s side door. If your tires are low, it also can reduce the life of them. Make it a habit to check your tires.
Use Credit Cards with Gas Rewards
These cards are usually issued in partnership with a bank and offer a discount on gas, like saving five or six cents off a gallon. Yes, mere pennies; but when you add it up, it makes a difference. A few of the top cards to check out are Citi Custom CashSM Card, Blue Cash Preferred® Card from American Express, and Discover it® Cash Back. Here are a few more. Another smart way to save is to get an app like GasBuddy that shows you the cheapest gas near you.
No one knows when gas prices will go down. In the meantime, the only thing you can do is try to work around the situation as best you can. The good news is that nothing lasts forever.
We’re all feeling the pain at the pump. Unless you decide to walk, bike or take public transportation, you might feel stuck. But all is not lost. Here are some fuel-efficient driving techniques that can help you save hundreds of dollars in fuel each year.
Don’t Drive Too Fast
Of course, when you’re on the highway, you must maintain a certain speed. However, cars, vans and pickups are typically the most fuel-efficient when driving between 50 and 80 mph. If you go any faster, you’ll use more gas. Consider this: When you’re driving roughly 75 miles per hour, you use 20 percent more fuel than you would if you were going around 60 mph. On a 15-mile trip, if you’re driving faster, you’ll only save two minutes. Only you know if shaving two minutes and gulping extra gas from your tank is worth it.
Maintain a Steady Speed
When you drive in bursts, slowing down and then accelerating, your fuel consumption increases. Specifically, tests have shown that varying your speed up and down between 75 and 85 mph every 18 seconds can bump up fuel usage by 20 percent. If your car has cruise control, use that. Word from the wise: Slow and steady wins the race.
Accelerate Gently
The heavier your foot is when putting the pedal to the metal, the more gas you use. Here’s how to accelerate and save gas: From a stop, take five seconds to get to 12 mph. You’ll speed on up after that, but the point is to pay attention to when you’re just starting and ease into your journey.
Coast to Decelerate
If you tend to have a heavy brake foot, you’re thwarting your forward momentum. Granted, you want to control your car if you’re in rain or snow. But here’s the trick: Look ahead to see what traffic is like and, if you have some room when you’re headed down that hill, take your foot off the gas and the brake, and enjoy the ride – you’ll conserve fuel and save money.
Try Not to Idle
Except when you’re in traffic, if you’re stopped longer than a minute, turn off your engine. The average vehicle with a three-liter engine drinks in over a cup of fuel for every 10 minutes it idles. Ouch!
Measure Tire Pressure
Do this every month. If your tires are under-inflated by 56 kilopascals (aka 8 pounds per square inch), fuel consumption rises by up to 4 percent. If you don’t know the right tire pressure for your car, look on the edge of the driver’s side door. If your tires are low, it also can reduce the life of them. Make it a habit to check your tires.
Use Credit Cards with Gas Rewards
These cards are usually issued in partnership with a bank and offer a discount on gas, like saving five or six cents off a gallon. Yes, mere pennies; but when you add it up, it makes a difference. A few of the top cards to check out are Citi Custom CashSM Card, Blue Cash Preferred® Card from American Express, and Discover it® Cash Back. Here are a few more. Another smart way to save is to get an app like GasBuddy that shows you the cheapest gas near you.
No one knows when gas prices will go down. In the meantime, the only thing you can do is try to work around the situation as best you can. The good news is that nothing lasts forever.
These articles provide general information on tax, accounting, and financial topics for small businesses and individuals. They are educational in nature and are not specific legal, accounting, financial, tax, or other professional advice, and should not be relied upon as such. This content was prepared by Service2Client and may have been reviewed or edited by the website owner for accuracy and compliance. Look for a trust mark below for verification details. No representation is made that any approach described will achieve a particular result, and no regulatory or professional body has reviewed or endorsed this content. Because each situation is different, readers should consult a qualified professional about their specific circumstances before acting. Images accompanying these articles are protected by copyright and may not be copied or reused.
Today, businesses have to grapple with vast amounts of data from different sources, including emails, mailing lists, customer orders, system logs, mobile apps, social media networks, etc. This data is crucial to businesses in various ways. When analyzed, a business can identify operational issues, personalize the customer experience and manage supply chains – all contributing to better decision-making.
However, big data also has challenges, especially regarding its storage due to size and other factors such as collection speed, processing, retrieval and format. This becomes more complicated as the data keeps growing with time and cannot be stored in traditional storage devices, necessitating a need for facilities that store and process the data efficiently.
Depending on the business type, a choice can be made between storing data in a warehouse or in the cloud. A data warehouse is a building facility that stores and processes data for a business. This in-house data storage offers the advantage of speed. However, when more space is needed, it will be necessary to acquire more physical storage.
On the other hand, a business may choose to opt for cloud storage. Cloud storage offers the benefit of convenience, accessibility, cost and maintenance, which the service provider handles.
Considerations in Storing Big Data
Regardless of the means a business chooses to store its data, there are various issues to consider:
Understand your data – before choosing a data storage method, it is essential to first understand the company’s data in terms of the type of data collected, quantity, storage period, retrieval speeds, use cases, etc. This helps choose a data management system that can handle the data efficiently.
Data governance – with so much data collected and with data growing exponentially, it is likely that users can be lost in a sea of data. Therefore, a business should define a strategy that aligns with business goals to avoid collecting unnecessary data that takes up storage space.
Data integration tools – data is collected from multiple sources, and it is necessary to have adequate integration tools that allow for different file formats.
Cost – it is difficult to determine the actual cost of storing data. Hence, a business should not base the cost decision on the upfront cost alone. This is because other factors are involved, including operating costs, the need for scalability, training or hiring users, new technologies, and the cost of backup. Businesses must evaluate whether the initial investment in the best data storage technologies is worthwhile by looking at the potential long-term results.
The data storage provider – before settling on a service provider, thorough research should be conducted. Some considerations when choosing from a variety of providers should include the availability of technical support to solve problems quickly, scalability, fault tolerance, pricing models, and reviews from existing customers.
Disaster recovery plan – ensure it is possible to recover data quickly. This is crucial with attacks that deny access to data without paying a ransom. A business should consider keeping secure offsite backups.
Enhanced security is required – the expanding IoT network adds to the number of endpoints and devices storing or retrieving data. Therefore, big data comes with a huge responsibility to preserve data in an environment where hackers are pervasive and never stop coming up with new ways to break into systems. It is recommended to choose the safest option even when it costs more, as data security is vital for the survival of any business.
Employee training – big data may require a business to hire new staff to help in analytics, such as data scientists. Regardless, a business should consider training existing employees on handling big data and using new tools that will be introduced. Big data also requires collaboration among different departments in an organization. Data-literate employees can better interpret data, ask the right questions, and generally make data-driven decisions.
Compliance with data security regulations – this especially applies to highly regulated industries such as finance or health. It is essential to ensure that even when outsourcing data storage and management, the service provider adheres to compliance regulations to avoid heavy fines that come with a violation.
Big Data Storage: What You Need to Know
July 1, 2022 · Blog, What's New in Technology
⏱ 4 min read
Today, businesses have to grapple with vast amounts of data from different sources, including emails, mailing lists, customer orders, system logs, mobile apps, social media networks, etc. This data is crucial to businesses in various ways. When analyzed, a business can identify operational issues, personalize the customer experience and manage supply chains – all contributing to better decision-making.
However, big data also has challenges, especially regarding its storage due to size and other factors such as collection speed, processing, retrieval and format. This becomes more complicated as the data keeps growing with time and cannot be stored in traditional storage devices, necessitating a need for facilities that store and process the data efficiently.
Depending on the business type, a choice can be made between storing data in a warehouse or in the cloud. A data warehouse is a building facility that stores and processes data for a business. This in-house data storage offers the advantage of speed. However, when more space is needed, it will be necessary to acquire more physical storage.
On the other hand, a business may choose to opt for cloud storage. Cloud storage offers the benefit of convenience, accessibility, cost and maintenance, which the service provider handles.
Considerations in Storing Big Data
Regardless of the means a business chooses to store its data, there are various issues to consider:
Understand your data – before choosing a data storage method, it is essential to first understand the company’s data in terms of the type of data collected, quantity, storage period, retrieval speeds, use cases, etc. This helps choose a data management system that can handle the data efficiently.
Data governance – with so much data collected and with data growing exponentially, it is likely that users can be lost in a sea of data. Therefore, a business should define a strategy that aligns with business goals to avoid collecting unnecessary data that takes up storage space.
Data integration tools – data is collected from multiple sources, and it is necessary to have adequate integration tools that allow for different file formats.
Cost – it is difficult to determine the actual cost of storing data. Hence, a business should not base the cost decision on the upfront cost alone. This is because other factors are involved, including operating costs, the need for scalability, training or hiring users, new technologies, and the cost of backup. Businesses must evaluate whether the initial investment in the best data storage technologies is worthwhile by looking at the potential long-term results.
The data storage provider – before settling on a service provider, thorough research should be conducted. Some considerations when choosing from a variety of providers should include the availability of technical support to solve problems quickly, scalability, fault tolerance, pricing models, and reviews from existing customers.
Disaster recovery plan – ensure it is possible to recover data quickly. This is crucial with attacks that deny access to data without paying a ransom. A business should consider keeping secure offsite backups.
Enhanced security is required – the expanding IoT network adds to the number of endpoints and devices storing or retrieving data. Therefore, big data comes with a huge responsibility to preserve data in an environment where hackers are pervasive and never stop coming up with new ways to break into systems. It is recommended to choose the safest option even when it costs more, as data security is vital for the survival of any business.
Employee training – big data may require a business to hire new staff to help in analytics, such as data scientists. Regardless, a business should consider training existing employees on handling big data and using new tools that will be introduced. Big data also requires collaboration among different departments in an organization. Data-literate employees can better interpret data, ask the right questions, and generally make data-driven decisions.
Compliance with data security regulations – this especially applies to highly regulated industries such as finance or health. It is essential to ensure that even when outsourcing data storage and management, the service provider adheres to compliance regulations to avoid heavy fines that come with a violation.
Disclaimer
These articles provide general information on tax, accounting, and financial topics for small businesses and individuals. They are educational in nature and are not specific legal, accounting, financial, tax, or other professional advice, and should not be relied upon as such. This content was prepared by Service2Client and may have been reviewed or edited by the website owner for accuracy and compliance. Look for a trust mark below for verification details. No representation is made that any approach described will achieve a particular result, and no regulatory or professional body has reviewed or endorsed this content. Because each situation is different, readers should consult a qualified professional about their specific circumstances before acting. Images accompanying these articles are protected by copyright and may not be copied or reused.
Supreme Court Police Parity Act of 2022 (S 4160) – In response to potential threats and protests outside the homes of Supreme Court judges following a leak of their preliminary judgement on a case related to Roe vs. Wade, this bill authorizes extra security for the justices and their families. Specifically, Supreme Court justices and their families would be provided with security detail similar to that of other top government officials and families in the executive branch (e.g., the president and vice president) and legislative branch (e.g., Speaker of the House and Senate Majority Leader). This type of detail generally cannot be declined. The bill was introduced by Sen. John Cornyn (R-TX) on May 5. It passed in both the Senate and the House on June 14 and was signed into law by the president on June 16.
Honoring our PACT Act of 2021 (HR 3967) – Introduced by Rep. Mark Takano (D-CA) on June 17, 2021, this bill recently passed in both the House and the Senate, but was returned with changes to the House on June 16. PACT is an acronym for Promise to Address Comprehensive Toxins Act. The bipartisan legislation, with 100 sponsors, would permit veterans who were exposed to burn pit smoke and other environmental hazards that caused cancers and other illnesses during their service, to receive health coverage for those ailments.
Air America Act of 2022 (S 407) – Air America was a government-owned airline deployed between 1950 and 1976 for the purpose of conducting certain covert operations in Southeast Asia during the Vietnam War. This bill is designed to restore benefits to the employees who worked for Air America during that period. Benefit applications must be filed within two years of the bill’s enactment. This legislation was introduced on Feb. 24, 2021, by Sen. Marco Rubio (R-FL). It passed in the Senate on June 14 and is currently in the House for consideration.
Post-Disaster Assistance Online Accountability Act (HR 2020) – Introduced by Jenniffer González-Colón, Resident Commissioner for Puerto Rico (R-PR) on March 18, 2021, this bill establishes a centralized website to publish information on disaster assistance. The Small Business Administration, the Department of Housing and Urban Development and other federal agencies that provide disaster assistance must submit the following information for publication on a quarterly basis: 1) the total amount of assistance provided by the agency; 2) the amount provided that was disbursed or obligated; and 3) a detailed list of all projects and activities to which assistance was allocated. The bill passed in the House on May 13 and is under consideration in the Senate.
Protecting Our Kids Act (HR 7910) – The bill was introduced by Rep. Jerry Nadler (D-NY) on May 31 and passed in the House on June 8. The purpose of this legislation is to ban the sale or transfer of certain semiautomatic firearms to anyone under age 21; establish new federal criminal offenses for gun trafficking; regulate guns that do not have serial numbers (ghost guns); regulate the storage of firearms on residential premises at federal, state and tribal levels; regulate bump stocks under federal firearms laws; and generally prohibit the import, sale, manufacture, transfer and possession of large capacity ammunition feeding devices. The bill is currently facing significant challenges in the Senate, where a bipartisan committee is working on an alternative.
Water Resources Development Act of 2022 (HR 1766) – This legislation authorizes the U.S. Army Corps of Engineers to implement projects associated with water resources development, including water supply and wastewater infrastructure, flood control, navigation and ecosystem/ shoreline restoration. The Act was introduced by Rep. Peter DeFazio (D-OR) on May 16. It passed in the House on June 8 and is currently under consideration in the Senate along with other similar bills.
Protecting SCOTUS, Veterans in Special Circumstances, Disaster Victims, Potential Firearm Victims, and America’s Water Resources
July 1, 2022 · Blog, Congress at Work
⏱ 4 min read
Supreme Court Police Parity Act of 2022 (S 4160) – In response to potential threats and protests outside the homes of Supreme Court judges following a leak of their preliminary judgement on a case related to Roe vs. Wade, this bill authorizes extra security for the justices and their families. Specifically, Supreme Court justices and their families would be provided with security detail similar to that of other top government officials and families in the executive branch (e.g., the president and vice president) and legislative branch (e.g., Speaker of the House and Senate Majority Leader). This type of detail generally cannot be declined. The bill was introduced by Sen. John Cornyn (R-TX) on May 5. It passed in both the Senate and the House on June 14 and was signed into law by the president on June 16.
Honoring our PACT Act of 2021 (HR 3967) – Introduced by Rep. Mark Takano (D-CA) on June 17, 2021, this bill recently passed in both the House and the Senate, but was returned with changes to the House on June 16. PACT is an acronym for Promise to Address Comprehensive Toxins Act. The bipartisan legislation, with 100 sponsors, would permit veterans who were exposed to burn pit smoke and other environmental hazards that caused cancers and other illnesses during their service, to receive health coverage for those ailments.
Air America Act of 2022 (S 407) – Air America was a government-owned airline deployed between 1950 and 1976 for the purpose of conducting certain covert operations in Southeast Asia during the Vietnam War. This bill is designed to restore benefits to the employees who worked for Air America during that period. Benefit applications must be filed within two years of the bill’s enactment. This legislation was introduced on Feb. 24, 2021, by Sen. Marco Rubio (R-FL). It passed in the Senate on June 14 and is currently in the House for consideration.
Post-Disaster Assistance Online Accountability Act (HR 2020) – Introduced by Jenniffer González-Colón, Resident Commissioner for Puerto Rico (R-PR) on March 18, 2021, this bill establishes a centralized website to publish information on disaster assistance. The Small Business Administration, the Department of Housing and Urban Development and other federal agencies that provide disaster assistance must submit the following information for publication on a quarterly basis: 1) the total amount of assistance provided by the agency; 2) the amount provided that was disbursed or obligated; and 3) a detailed list of all projects and activities to which assistance was allocated. The bill passed in the House on May 13 and is under consideration in the Senate.
Protecting Our Kids Act (HR 7910) – The bill was introduced by Rep. Jerry Nadler (D-NY) on May 31 and passed in the House on June 8. The purpose of this legislation is to ban the sale or transfer of certain semiautomatic firearms to anyone under age 21; establish new federal criminal offenses for gun trafficking; regulate guns that do not have serial numbers (ghost guns); regulate the storage of firearms on residential premises at federal, state and tribal levels; regulate bump stocks under federal firearms laws; and generally prohibit the import, sale, manufacture, transfer and possession of large capacity ammunition feeding devices. The bill is currently facing significant challenges in the Senate, where a bipartisan committee is working on an alternative.
Water Resources Development Act of 2022 (HR 1766) – This legislation authorizes the U.S. Army Corps of Engineers to implement projects associated with water resources development, including water supply and wastewater infrastructure, flood control, navigation and ecosystem/ shoreline restoration. The Act was introduced by Rep. Peter DeFazio (D-OR) on May 16. It passed in the House on June 8 and is currently under consideration in the Senate along with other similar bills.
Disclaimer
These articles provide general information on tax, accounting, and financial topics for small businesses and individuals. They are educational in nature and are not specific legal, accounting, financial, tax, or other professional advice, and should not be relied upon as such. This content was prepared by Service2Client and may have been reviewed or edited by the website owner for accuracy and compliance. Look for a trust mark below for verification details. No representation is made that any approach described will achieve a particular result, and no regulatory or professional body has reviewed or endorsed this content. Because each situation is different, readers should consult a qualified professional about their specific circumstances before acting. Images accompanying these articles are protected by copyright and may not be copied or reused.
With the S&P down nearly 20 percent and the Nasdaq index down nearly 4,000 points since the beginning of 2022, one could say the indices are in a bear market. While we can’t predict the future, economic indicators can offer some insight into the likelihood of the market’s future performance.
There are many ways to determine how the market might act the next day, week or longer into the future. Looking at sectors and how they’ve performed against the entire market is a good way to see if it’s bottomed out or if it’s time to look at other sectors. Volatility and the near-term expectations are other ways to see how professional investors gauge the market’s future moves. Reviewing the current and expected path of monetary policy and evolving economic indicators are still other ways to determine how markets will likely perform going forward.
The VIX and Market Capitulation
The Chicago Board Options Exchange’s (CBOE) Volatility Index (VIX) or “fear gauge” is one indicator of a market bottom. When investors attempt to hedge their investments, especially when volatility is expected, long options on the VIX can provide an “insurance policy” against falling equity prices. While there have been many levels on the VIX in the mid-30s, it often reaches levels in the 40s, 50s or even potentially higher to see a true bottom or market capitulation. Looking back to the 2008/2009 financial crisis, the VIX spiked to 79.13 on Oct. 20, 2008. Similarly, the VIX spiked to 82.69 on March 16, 2020, during the lows of the COVID-19 crash.
Measuring the Put/Call Ratio
Another indicator to gauge if the market has bottomed is when there’s a large consensus of bearishness. Using the put/call ratio, investors can see the current and past ratios of puts to calls presently held in the market. As the number of puts increase relative to call options, or the number of contracts betting stocks will increase in price over time, it indicates the market movers are expecting a down-turn in the markets. As the put/call ratio rises, it implies investors are feeling more and more bearish about the markets. When the ratio hits an extreme, higher implying a market bottom and lower implying a market top, investors are signaling they are nearing a turn in the markets.
Analyzing Moving Averages
When it comes to moving averages (a 50-, 100- or 200-day, for example), it can help establish trends for stock price action. Depending on the moving average used, the lower the number of stocks above or below a particular moving day average, the sector’s or index’s strength and direction can be measured. When it comes to measuring an index or a sector with a moving average, if a trend is showing more stocks are declining and staying below a moving average, it gives investors a sign of bearishness. If a big percentage, such as 70 percent or 80 percent of an index or sector, is below a particular moving average, this can indicate it may be forming a bottom or oversold conditions.
The Federal Reserve and Managing Inflation
According to the Federal Reserve Bank of San Francisco, the historic range for the federal funds rate grew from 11 1/3 percent to 11 3/4 percent based on decisions from the September 1979 Federal Open Market Committee (FOMC) meeting. The Oct. 6, 1979, FOMC meeting created a four percent range for the federal funds rate (11.5 percent to 15.5 percent). By the end of 1979, the federal funds rate was nearly 14 percent, reaching 17.60 percent during 1980. Then January 1989 saw a recession due to the Fed changing reserve requirements, adding on additional fees for loans directly from the Fed, and promoting the economy to be more judicious in obtaining new loans. These changes led to interest rates rising toward the end of 1980, creating another recession in July 1980. While unemployment increased, inflation fell to four percent as 1982 closed out, compared to inflation running 14.6 percent annually between May 1979 and April 1980.
Immediately before the Oct. 6, 1979, FOMC meeting, the S&P 500 index hit a peak of 111.27 at closing the day before. Following a trend that began the Monday after the FOMC meeting, it eventually hit a “double-bottom”: 100 on Oct. 25, 1979, and then 99.87 on Nov. 7, 1979. It eventually reached a high of 118.44 on Feb. 13, 1980, before falling back to its last lows on March 27, 1980, to 98.22, and then eventually seeing an upturn.
While there are many economic, technical and fundamental indicators to gauge the direction of the stock market, taking a comprehensive approach to analyze the markets is not foolproof and risk can be mitigated only to a certain degree.
Have the Markets Bottomed or is it a Bear Market Rally?
June 1, 2022 · Blog, Stock Market News
⏱ 4 min read
With the S&P down nearly 20 percent and the Nasdaq index down nearly 4,000 points since the beginning of 2022, one could say the indices are in a bear market. While we can’t predict the future, economic indicators can offer some insight into the likelihood of the market’s future performance.
There are many ways to determine how the market might act the next day, week or longer into the future. Looking at sectors and how they’ve performed against the entire market is a good way to see if it’s bottomed out or if it’s time to look at other sectors. Volatility and the near-term expectations are other ways to see how professional investors gauge the market’s future moves. Reviewing the current and expected path of monetary policy and evolving economic indicators are still other ways to determine how markets will likely perform going forward.
The VIX and Market Capitulation
The Chicago Board Options Exchange’s (CBOE) Volatility Index (VIX) or “fear gauge” is one indicator of a market bottom. When investors attempt to hedge their investments, especially when volatility is expected, long options on the VIX can provide an “insurance policy” against falling equity prices. While there have been many levels on the VIX in the mid-30s, it often reaches levels in the 40s, 50s or even potentially higher to see a true bottom or market capitulation. Looking back to the 2008/2009 financial crisis, the VIX spiked to 79.13 on Oct. 20, 2008. Similarly, the VIX spiked to 82.69 on March 16, 2020, during the lows of the COVID-19 crash.
Measuring the Put/Call Ratio
Another indicator to gauge if the market has bottomed is when there’s a large consensus of bearishness. Using the put/call ratio, investors can see the current and past ratios of puts to calls presently held in the market. As the number of puts increase relative to call options, or the number of contracts betting stocks will increase in price over time, it indicates the market movers are expecting a down-turn in the markets. As the put/call ratio rises, it implies investors are feeling more and more bearish about the markets. When the ratio hits an extreme, higher implying a market bottom and lower implying a market top, investors are signaling they are nearing a turn in the markets.
Analyzing Moving Averages
When it comes to moving averages (a 50-, 100- or 200-day, for example), it can help establish trends for stock price action. Depending on the moving average used, the lower the number of stocks above or below a particular moving day average, the sector’s or index’s strength and direction can be measured. When it comes to measuring an index or a sector with a moving average, if a trend is showing more stocks are declining and staying below a moving average, it gives investors a sign of bearishness. If a big percentage, such as 70 percent or 80 percent of an index or sector, is below a particular moving average, this can indicate it may be forming a bottom or oversold conditions.
The Federal Reserve and Managing Inflation
According to the Federal Reserve Bank of San Francisco, the historic range for the federal funds rate grew from 11 1/3 percent to 11 3/4 percent based on decisions from the September 1979 Federal Open Market Committee (FOMC) meeting. The Oct. 6, 1979, FOMC meeting created a four percent range for the federal funds rate (11.5 percent to 15.5 percent). By the end of 1979, the federal funds rate was nearly 14 percent, reaching 17.60 percent during 1980. Then January 1989 saw a recession due to the Fed changing reserve requirements, adding on additional fees for loans directly from the Fed, and promoting the economy to be more judicious in obtaining new loans. These changes led to interest rates rising toward the end of 1980, creating another recession in July 1980. While unemployment increased, inflation fell to four percent as 1982 closed out, compared to inflation running 14.6 percent annually between May 1979 and April 1980.
Immediately before the Oct. 6, 1979, FOMC meeting, the S&P 500 index hit a peak of 111.27 at closing the day before. Following a trend that began the Monday after the FOMC meeting, it eventually hit a “double-bottom”: 100 on Oct. 25, 1979, and then 99.87 on Nov. 7, 1979. It eventually reached a high of 118.44 on Feb. 13, 1980, before falling back to its last lows on March 27, 1980, to 98.22, and then eventually seeing an upturn.
While there are many economic, technical and fundamental indicators to gauge the direction of the stock market, taking a comprehensive approach to analyze the markets is not foolproof and risk can be mitigated only to a certain degree.
Disclaimer
These articles provide general information on tax, accounting, and financial topics for small businesses and individuals. They are educational in nature and are not specific legal, accounting, financial, tax, or other professional advice, and should not be relied upon as such. This content was prepared by Service2Client and may have been reviewed or edited by the website owner for accuracy and compliance. Look for a trust mark below for verification details. No representation is made that any approach described will achieve a particular result, and no regulatory or professional body has reviewed or endorsed this content. Because each situation is different, readers should consult a qualified professional about their specific circumstances before acting. Images accompanying these articles are protected by copyright and may not be copied or reused.
COVID-19 impacted the economy dramatically and commercial real estate was no exception in terms of decreased values. Often, the real property could no longer service the debt used to finance it. This debt restructuring and resulting debt forgiveness can result in taxable income.
Taxable Income and Debt Cancellation
If you have a $80,000 loan and the bank reduced the amount you owe down to $50,000, then you have an economic benefit of $30,000, which should be treated as taxable income. This is indeed how cancellation of debt is treated, but there are exceptions such as in the case of bankruptcy or insolvency. There is another unique scenario that applies only to commercial real estate.
Assuming that the taxpayer is not a C-corporation, debt cancellation is excludable from taxable income if it results from qualified real property business indebtedness (QRPBI). QRPBI is debt taken on to buy real property used for commercial purposes. Starting in 1993, debt used for building or improving a property also qualify.
As we all know, there is no such thing as a free lunch. In order for debt cancellation to not be considered current taxable income, the taxpayer must reduce their basis in the real property by this same amount. This does not cancel the income; instead, it defers its recognition and helps cash flow as a result. Below, we look at an example of how this works.
Illustrative Example
Assume David bought a property in 2017 and he uses it for business purposes. In 2022, the property has a first mortgage of $200,000 and a second mortgage of $100,000 (both with the same bank), with a fair market value (FMV) of $240,000. He negotiates with the bank to reduce the second mortgage down to $20,000, resulting in income from the cancellation of debt of $80,000.
The amount of debt cancellation that can be deferred is equal to the amount of the second mortgage before the debt cancellation, less the FMV minus the first mortgage. In David’s case, before debt cancellation, the FMV ($240k) minus the first mortgage ($200k) was $40,000. The balance of the second mortgage ($100k) exceeded this by $60,000. Out of the total debt cancellation of $80,000, this $60k is subject to deferral, with only the remaining $20,000 reported as immediate taxable income.
The $60,000 is not considered as taxable income only to the extent that David has sufficient adjusted tax basis in the depreciable real property to absorb this as a reduction in basis. Assuming this is the case, the reduction in basis applies the first day of the tax year after the debt cancellation (unless the property is sold before year-end – then it applies immediately).
In the example above, David would include the $10,000 of cancellation of debt income on his 2022 tax return and adjust his basis in the real property by $60,000 as of Jan. 1, 2023.
Filing Mechanics
For real estate held via partnerships instead of by individuals, determining if debt is QRPBI qualified happens at the entity level, although reductions of basis are done at the individual level for each partner, allowing individual planning. The election to defer cancellation of debt income is recorded on Form 982.
Conclusion
The COVID pandemic caused many real estate investors to restructure their debts. The option to defer debt income cancellation offers a great tax planning opportunity by delaying taxable income and improving cash flows.
Tax Break for Commercial Real Estate Investors
June 1, 2022 · Blog, Tax and Financial News
⏱ 3 min read
COVID-19 impacted the economy dramatically and commercial real estate was no exception in terms of decreased values. Often, the real property could no longer service the debt used to finance it. This debt restructuring and resulting debt forgiveness can result in taxable income.
Taxable Income and Debt Cancellation
If you have a $80,000 loan and the bank reduced the amount you owe down to $50,000, then you have an economic benefit of $30,000, which should be treated as taxable income. This is indeed how cancellation of debt is treated, but there are exceptions such as in the case of bankruptcy or insolvency. There is another unique scenario that applies only to commercial real estate.
Assuming that the taxpayer is not a C-corporation, debt cancellation is excludable from taxable income if it results from qualified real property business indebtedness (QRPBI). QRPBI is debt taken on to buy real property used for commercial purposes. Starting in 1993, debt used for building or improving a property also qualify.
As we all know, there is no such thing as a free lunch. In order for debt cancellation to not be considered current taxable income, the taxpayer must reduce their basis in the real property by this same amount. This does not cancel the income; instead, it defers its recognition and helps cash flow as a result. Below, we look at an example of how this works.
Illustrative Example
Assume David bought a property in 2017 and he uses it for business purposes. In 2022, the property has a first mortgage of $200,000 and a second mortgage of $100,000 (both with the same bank), with a fair market value (FMV) of $240,000. He negotiates with the bank to reduce the second mortgage down to $20,000, resulting in income from the cancellation of debt of $80,000.
The amount of debt cancellation that can be deferred is equal to the amount of the second mortgage before the debt cancellation, less the FMV minus the first mortgage. In David’s case, before debt cancellation, the FMV ($240k) minus the first mortgage ($200k) was $40,000. The balance of the second mortgage ($100k) exceeded this by $60,000. Out of the total debt cancellation of $80,000, this $60k is subject to deferral, with only the remaining $20,000 reported as immediate taxable income.
The $60,000 is not considered as taxable income only to the extent that David has sufficient adjusted tax basis in the depreciable real property to absorb this as a reduction in basis. Assuming this is the case, the reduction in basis applies the first day of the tax year after the debt cancellation (unless the property is sold before year-end – then it applies immediately).
In the example above, David would include the $10,000 of cancellation of debt income on his 2022 tax return and adjust his basis in the real property by $60,000 as of Jan. 1, 2023.
Filing Mechanics
For real estate held via partnerships instead of by individuals, determining if debt is QRPBI qualified happens at the entity level, although reductions of basis are done at the individual level for each partner, allowing individual planning. The election to defer cancellation of debt income is recorded on Form 982.
Conclusion
The COVID pandemic caused many real estate investors to restructure their debts. The option to defer debt income cancellation offers a great tax planning opportunity by delaying taxable income and improving cash flows.
Disclaimer
These articles provide general information on tax, accounting, and financial topics for small businesses and individuals. They are educational in nature and are not specific legal, accounting, financial, tax, or other professional advice, and should not be relied upon as such. This content was prepared by Service2Client and may have been reviewed or edited by the website owner for accuracy and compliance. Look for a trust mark below for verification details. No representation is made that any approach described will achieve a particular result, and no regulatory or professional body has reviewed or endorsed this content. Because each situation is different, readers should consult a qualified professional about their specific circumstances before acting. Images accompanying these articles are protected by copyright and may not be copied or reused.

 Whether it’s tariffs, trade wars, or post-pandemic inflation caused by kink-ridden supply chains and what many experts believe to be excess money printing, inflation is an insidious drag on businesses’ operations. When it comes to energy’s contribution to inflation, the U.S. Energy Information Administration (EIA) reports that crude and natural gas prices in 2022 have increased on an annualized and weekly basis. Looking at the snapshot of 7/21/2022, WTI crude on the futures market was $96.35 a barrel. This was up more than $26 compared to 12 months ago, and $0.57 higher than a week earlier. For the same time frame, natural gas futures were $7.932/MMBtu, an increase of $3.973 from 12 months ago and an increase of $1.332 from a week earlier.



 Starting June 1, the Fed began reducing its balance sheet holdings of U.S. Treasuries by $30 billion a month for three months. Thereafter, it will double its reduction of U.S. Treasuries by $60 billion per month beginning in the fourth month. For its mortgage-backed securities, the first three months will see $17.5 billion roll off its balance sheet. Starting in the fourth month of the program, this cap will increase to $35 billion per month. As its dual mandate is to both maintain employment and a stable rate of inflation, this is another way the Fed is implementing its monetary policy to put the brakes on inflation and reign in out-of-control demand with limited supply. How will the Fed’s unwinding of its balance sheet impact markets for the rest of 2022?
 One of the perennial fears of taxpayers is getting audited by the IRS. Financially, few scenarios strike such fear into the heart of taxpayers. However, taxpayers can probably breathe a sigh of relief – at least for now. This is because the rate at which the IRS is initiating audits of individual taxpayers is dropping like a stone.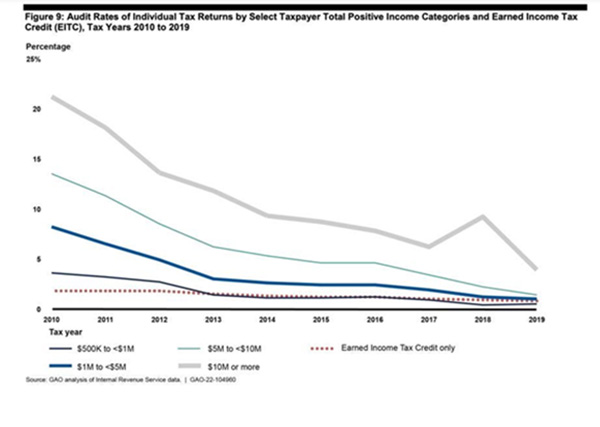
 Corporate profits, according to the Bureau of Economic Analysis, grew by $20.4 billion in the final quarter of 2021, a 0.7 percent increase. For the first quarter of 2022, corporate profits fell by 2.3 percent or $66.4 billion. On an annualized basis, corporate profits fell 5.2 percent in 2022, but grew 25 percent in 2021. With the economy facing inflation, the uncertainty of the Russia/Ukraine conflict, and the world working its way out of the COVID-19 pandemic, economic uncertainty abounds. For companies, measuring margins is one way to evaluate performance and strategize ways to survive and thrive in a dynamic economy. Here are a few common margins that businesses can determine to measure their financial performance.
 Often the first house a person buys is an affordable condominium, townhouse or older single-family dwelling, also referred to as a “starter home.” It might be small and lack features they dream about, from new appliances in the kitchen, to dual sinks in the bath, to a large yard or a garage.
 We’re all feeling the pain at the pump. Unless you decide to walk, bike or take public transportation, you might feel stuck. But all is not lost. Here are some fuel-efficient driving techniques that can help you save hundreds of dollars in fuel each year.
 Today, businesses have to grapple with vast amounts of data from different sources, including emails, mailing lists, customer orders, system logs, mobile apps, social media networks, etc. This data is crucial to businesses in various ways. When analyzed, a business can identify operational issues, personalize the customer experience and manage supply chains – all contributing to better decision-making.
 Supreme Court Police Parity Act of 2022 (S 4160) – In response to potential threats and protests outside the homes of Supreme Court judges following a leak of their preliminary judgement on a case related to Roe vs. Wade, this bill authorizes extra security for the justices and their families. Specifically, Supreme Court justices and their families would be provided with security detail similar to that of other top government officials and families in the executive branch (e.g., the president and vice president) and legislative branch (e.g., Speaker of the House and Senate Majority Leader). This type of detail generally cannot be declined. The bill was introduced by Sen. John Cornyn (R-TX) on May 5. It passed in both the Senate and the House on June 14 and was signed into law by the president on June 16.
 With the S&P down nearly 20 percent and the Nasdaq index down nearly 4,000 points since the beginning of 2022, one could say the indices are in a bear market. While we can’t predict the future, economic indicators can offer some insight into the likelihood of the market’s future performance.
 COVID-19 impacted the economy dramatically and commercial real estate was no exception in terms of decreased values. Often, the real property could no longer service the debt used to finance it. This debt restructuring and resulting debt forgiveness can result in taxable income.